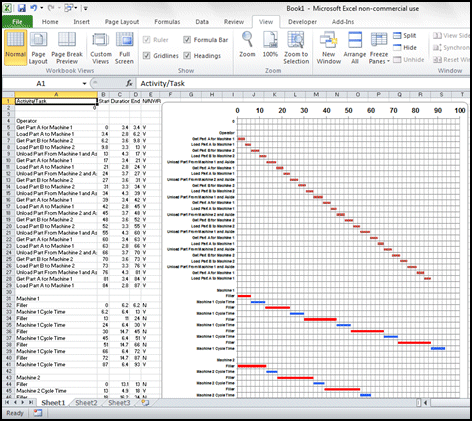
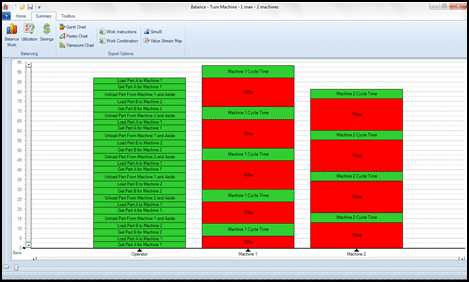
A man-machine chart graphically represents the relationship between the manual work performed by one or more operators and one or more machines involved in a manufacturing process.
Timer Pro’s work balancing features allow you to quickly develop man-machine charts from any process as shown in the sample here.
Given the different work steps required in a production process to load, operate and unload machines in conjunction with the process times of the machines themselves the man-machine chart is used to determine the highest production level that can be achieved given the resources available. This process usually involves performing as much manual work as possible internal to the machine cycles i.e. when the machine is running so that when a the machine cycle is complete the production generating machine cycle can be restarted again with as little downtime as possible.
The data in the chart can also be presented in Excel where you can instantly see the manual work performed simultaneous to the machine cycle times (shown on the chart in blue).
Google Unwanted Software Policy Compliance Statement
We hereby attest that the software application offered here is developed, owned and distributed by us for the purposes of process measurement to support your continuous improvement initiatives; will not affect the performance of your system hardware or change any system settings; is easily completely removable from your system; does not collect or transmit any private information in any form; is not bundled with any other software; is free of malware.