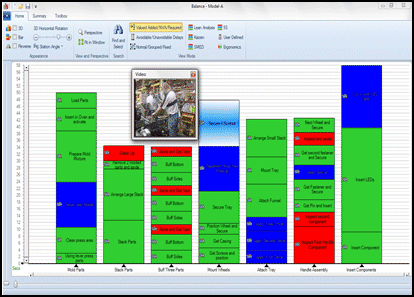
A Yamazumi chart is a stacked bar chart that shows the balance of cycle time workloads between a number of operators typically in an assembly line or work cell. The Yamazumi chart can be either for a single product or multi product assembly line.
Yamazumi is a Japanese word that literally means to stack up.
Toyota uses Yamazumi work balance charts to visually present the work content of a series of tasks and facilitate work balancing and the isolation and elimination of non value added work content.
Video Timer Pro automatically embeds videos in each activity chip when measuring the work content. Clicking on the chip instantly replays the content to explore improvement opportunities or for operator training.
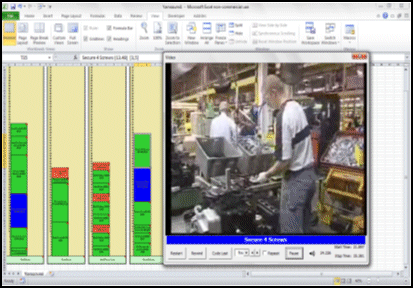
A single click in Timer Pro will send the entire Yamazumi balance chart to Excel (shown below). The system automatically sizes the work elements in proportion to the work content. Additionally, it embeds video snippets in the Excel sheet. Charts can be printed from Excel in any size – some companies print them out over 3 feet tall for worker and management review.
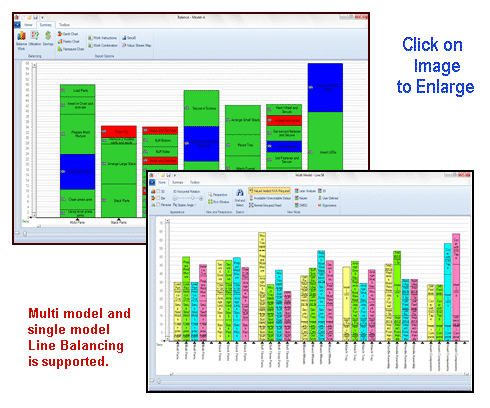
Timer Pro Professional’s work balance module allows you to develop and manage Yamazumi charts for any process. It can be output in any size – ideal for workplace presentations.
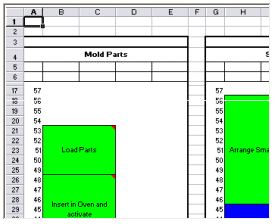
On the Excel Yamazumi chart each row represents one unit of time – either seconds, minutes or hours
For use on the production floor, you may provide supervisors and operators access to copies of your Yamazumi charts.
They may then identify additional improvement opportunities by with the user friendly drag and drop features
Google Unwanted Software Policy Compliance Statement
We hereby attest that the software application offered here is developed, owned and distributed by us for the purposes of process measurement to support your continuous improvement initiatives; will not affect the performance of your system hardware or change any system settings; is easily completely removable from your system; does not collect or transmit any private information in any form; is not bundled with any other software; is free of malware.